American River Software
 The Mutual Fund Investor
Version 3.8 - Free!
![]() 4 MB Installation file
4 MB Installation file
The Software
The Mutual Fund Investor is a comprehensive software program that allows you to make important decisions about your mutual fund investments quickly and easily. This full-featured program for financial planners and individual investors enables all aspects of mutual fund investing to be performed conveniently, professionally, and in a customized fashion.
Online Manual
The help manual that accompanies the program during installation may be viewed online here.
Requirements
Windows 95/98/Me/NT/2000/XP/Vista/7/8/10/11
Comparing Performance of Funds
Funds may be compared graphically with one another by directly superimposing their performance curves on top of each other. Or, to compare the performances of all the funds you monitor, an easy to read table format is provided. For example, just "point" to any time interval on any graph, such as the most recent stock market rise or any market downturn. Then press a key or click a button and a table appears ranking all your monitored funds from best to worst for the time interval you chose. This can greatly help you narrow your investment choice to the two or three recently best performing funds. You may also compare any fund with market indices (e.g., the S&P 500), stocks, or any other market indicator (e.g., the prime rate). The ability to compare funds over any time period you want is a valuable feature of the program. You won't have to wait for the next newsletter to come out, and you won't have to be content with some magazine's arbitrarily chosen year-end to year-end time scale to examine performances.
Built-In Timing Service
Buy/sell signals are generated by the program based upon moving averages, a well known method for tracking mutual funds used by professionals and expensive timing services. Now you can do it yourself for free, and you can define your own rules for buying and selling. Every time data is entered for your monitored funds, buy/sell signals are internally updated by the program ready for you to examine.
Portfolio Management
Whether you are a financial planner managing thousands of clients, constantly entering hundreds of transactions, or an individual managing your own or your family's portfolio, The Mutual Fund Investor handles your requirements effortlessly and easily. For each transaction, a comment may be appended to jog your memory at some later date explaining why the transaction was made. After any closing price for a security is entered, all portfolios are automatically updated so that you can assess instantly the status of an account. Several useful reports can be generated from your portfolio entries, such as monthly profit/loss reports, total commissions paid or income received, etc. For any portfolio, you can immediately display a list of all open accounts, including current value, number of shares, account numbers, etc. And, you can cross reference portfolios. For example, suppose you get a sell signal on one of the funds you monitor. You may instantly generate a report displaying all portfolios invested in that fund, along with the pertinent information needed for redeeming or closing the account. A sophisticated asset allocation feature is also included in the program containing ten general categories, each with multiple subcategories. Reports of profit/loss, internal rate of return, and asset allocation may be generated for one portfolio, all portfolios, or for any "family" or selected group of portfolios.
Graphics
Two, three, and four-year daily charts or 5, 10, 15, or 20-year weekly charts may be displayed for any fund along with one or two moving averages, and you may "zoom" in on any portion for close examination. From the graphs, you may generate performance tables and momentum scores. Graphs may be printed or saved to a file to be later imported to other graphics programs, and the graphs may be customized for colors, titles, color gradients, cross hairs, and grids. Relative strength graphs (relative to any market index or another fund) are also supported along with moving averages of relative strength.
Data Entry
Flexibility is provided both for the conscientious investor who wants to track his investments on a daily basis as well as the casual investor who may only infrequently want to see how well his investment is performing. For the casual user, data may be entered haphazardly -- enter data one week, skip a month, enter data for another week, skip a week, etc. For any investor, if a mistake is made, you can easily go back and enter the correct data. Data can be entered manually by looking up the prices in the newspaper or transferred to and from another program. For added convenience, a completely automatic retrieval of data over the internet is available through Dial Data. You simply highlight on the computer screen those funds and the time interval for which you want data, and the computer takes care of the rest. It retrieves the data, plugs it into the program, and calculates all the parameters you follow as well as updating all your portfolios. For both the casual and conscientious user, updating precise data is easy, with a minimum of time and hassle. Distributions are also easily handled, both for manual input as well as for downloading from Dial Data, and the program can also automatically enter your distributions as investment transactions for all portfolios based upon specified reinvestment options.
Ease of Use
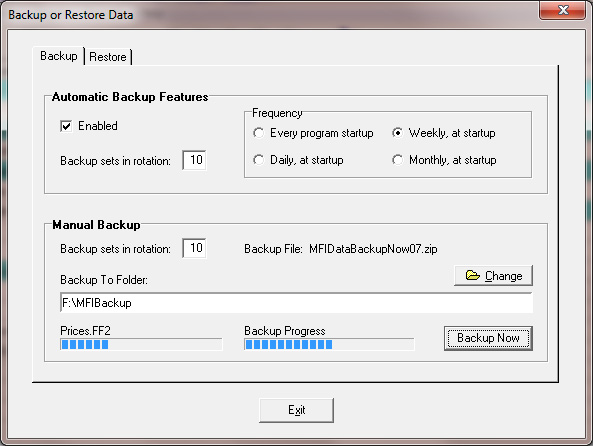
Every aspect of the program was designed so that no sophisticated knowledge of computers is required. This is a program for investors - not computer scientists! Help messages are displayed throughout the program. If you need more help, the entire documentation of the program (context sensitive help) is on disk and available at the click of a mouse which brings up the standard Windows help for the program. A convenient and valuable data management system is also built right into the program. Automatic and manual data backups are supported. Restoring from a backup is also very easy.
Ability To Customize The Program
You may substitute any fund, stock, money market account, market index, or any investment vehicle of your choice into the program. A "Master List" table with a capacity for thousands of entries (only limited by disk space) is maintained by the program. From this table, you may choose any number of securities to monitor which may be classified under 100 columns that you can name (e.g., Aggressive, Moderate, Conservative, International, Sector, etc.) to reflect the nature of the securities in the column. Tables in the program can also be customized for color and column width.
History and Enhancements
Version 3.8 is the current Windows version. As enhancements and bug fixes occur, they will be posted here.
Version 3.8 Build 160 - December 14, 2021
- Changed Dial Data connection address to dd.dialdata.com.
Version 3.7 Build 158 - April 29, 2018
- Recoded automatic backup routine when program starts - more accurately reflects choices made (e.g., weekly, monthly, etc.).
Version 3.7 Build 157 - September 4, 2017
- Corrected bug in display Portfolio Report Summary - total value could have had a penny discrepancy compared to the sum of the individual securities values.
Version 3.7 Build 156 - October 14, 2014
- Filtered out possible data entry on Saturday/Sunday dates when downloading from Dial Data, or importing text files.
Version 3.6 Build 155 - December 20, 2010
- Refreshed Main Menu status bar at several points, since it did not display properly in Windows 7 when starting the program.
Version 3.6 Build 154 - October 18, 2010
- Updates to MFI must now be downloaded directly from this web site. Downloading from within the program is no longer supported.
- Minor adjustments to display of some tables.
Version 3.6 Build 150 - June 27, 2008
- Installation of program via InstallAware. Configuration of installation folders complies with Windows Vista.
- Deleted feature to convert Version 1 data to current version.
- Deleted feature to import data from old DOS version.
Version 3.5 Build 132 - May 28, 2006
- Individual columns in Master List Summary Report may be sorted.
- Added safety feature for key value assignment when add new entry into Master List.
Version 3.5 Build 124 - March 23, 2004
- Corrected change in Dial Data font displayed when downloading data.
- Display information message when no distributions available (for requested date range) to download from Dial Data.
Version 3.5 Build 123 - January 30, 2004
- Corrected bug in Cost-Basis report affecting testing for split transaction when closing account.
Version 3.5 Build 120 - September 6, 2003
- Enable downloading distributions of mutual funds or stocks (dividends) from Dial Data.
- File size of MFI backup files displayed in table in Backup/Restore section.
- Corrected bug in Cost-Basis report affecting transactions with splits.
- CUSIP column now display in "Find Master List Entry" dialog box.
Version 3 Build 115 - January 9, 2003
- Added ability to read Windows registry for new and old installations.
Version 3 Build 110 - December 28, 2002
- New installation interface, incorporating Microsoft's Windows Installer Service.
Version 3 Build 107 - September 13, 2002
- New feature - FundScope Summary report. If FundScope installed, a summary of statistics present in the FundScope database is available and can be printed.
- Bug fix - distributions received as cash now do not affect total cost calculation, and are displayed in report as "Received".
Version 3 Build 105 - August 27, 2002
- New feature - FundScope QuickFill, which fills in Master List entry fields when adding a new fund to the Master List. FundScope must be installed to access this feature.
Version 3 Build 104 - August 19, 2002
- Portfolio Summary report information displayed on one line, report forced to print in Landscape.
- Widened tables so font size problem reported by some users is fixed.
- Reopen feature enabled, displaying up to 10 most recently accessed Master Lists.
- Save open/closed accounts display status, comparison fund, benchmark fund, and last used portfolio when switching between Master Lists.
Version 3 Build 98 - May 12, 2002
- Graphs of single or multiple portfolios enabled.
- Cost-Basis Report enabled. Previous Cumulative Shares Report included in Cost-Basis report.
- Color scheme enabled for open/closed accounts on Master List.
- Find feature added for Master List (useful for large Master Lists).
- Complete context sensitive help included, with updated Ticker symbols for Dial Data.
- Deleted ability to download from S&P Micropal as service no longer exists.
- Enhancements to entering transactions - When deleting, highlight placed at next record, not at end of table. When right-click on a displayed record, popup menu prompts to edit or delete. Can delete blocks of transactions all at once. Expanded drop-down boxes for securities and portfolios with type-ahead feature. When enter new record, display in table is at end, not just before last record.
- Enhancements to entering prices - Edit prices for active column - form does not close now after entering/editing price, and can switch between Master List columns. Enable up to 6 decimals for entry. In reports, 3 decimals used (6 for variable annuities).
- Entering Distributions - Can enter and display up to 5 decimal places.
- Enhancements to Reports - Portfolio Summary Report - can change date of report to an older date.
- Portfolio Summary Report - printing multiple portfolios now sorted alphabetically by short portfolio name. Print macros for Portfolio Summary Report and Cost-Basis report for multiple portfolios.
- Minor changes - Export prices - can now export adjusted prices. Gradient color direction displays correctly for graphs.
Version 2 Build 84 - August 17, 2001
- Dial Data download address changed.
- New updated database tables.
- Included conversion utility to convert version 1.0 tables to version 2.0 tables.
Version 1 Build 83 - May 13, 2001
- Bug fix: When importing/entering prices for a security, sometimes adjusted prices would be reset to unadjusted prices (no distribution correction for graphs).
- Minor enhancements: prices and adjusted prices for any number of Master List entries may be reset (access via the "Edit" menu). Restore screen made clearer. Some icons added to some menu items.
Version 1 Build 82 - March 11, 2001
- Bug fix: "List Index Out Of Bounds" error occasionally occurred when displaying graphs and when switching between daily and weekly displays.
- New feature: Transaction tics when graph of security displayed. Switching between portfolios enabled when graph displayed, with refreshing of appropriate tics. User-defined color of tics allowed, with storing of color between program sessions. Transaction summary displayed at bottom of graph, and transactions corresponding to tics may be viewed. Tics may be left on graph while displaying other non-transaction information at bottom of graph.
- New feature: Volatility Between Dates report from graphs.
- New feature: Moving Average Indicator report from graphs.
Version 1 Build 80 - January 12, 2001
- New feature: editing of prices of securities just in active column of Master List (choose "Edit|Prices - Active Column").
- New feature: deletes extraneous InstallShield files from prior installations.
- New feature: UpdateMFI contains some additional steps to make the download of updates successful for some users. Also, old MFI.EXE is renamed to MFIOld.EXE before overwriting with the new MFI.EXE, which allows for quick restoration in case downloading MFI.EXE is unsuccessful. If that happens, just delete any MFI.EXE and rename MFIOld.EXE to MFI.EXE.
- Bug fix: importing prices/distributions directly from FundScope (short-term and long-term capital gains data now recognized but added together as one capital gain).
- Bug fix: importing data or downloading data for security without prior data entered. May have received errors when trying to display graph or move date lines, now corrected for future downloads. To correct data for existing securities, highlight security and click on "Edit|Prices - Selected Entry", display data for year data exists, then click "Save" button.
- Appearance change: Portfolio Summary Report. Decimals now align in "Shares/Value" column.
Version 1 Build 79 - October 22, 2000
- Bug fix: When downloading distributions on more than one fund from S&P Micropal, readjustment of prices on all funds did not occur after entry of the distributions.
Version 1 Build 78 - October 15, 2000
- Bug fix: "Import Data, Prices, Distributions" did not accept some displayed date formats.
Version 1 Build 77 - October 4, 2000
- Enabled direct import of prices/distributions from FundScope.
- Bug fix: Ticker for Dial Data will now be accepted whether or not Ticker stored in MFI is in upper or lower case.
- Bug fix: Because of screen resolution, dates lines on graphs may occasionally disappear when date lines directly adjacent to one another. Popup note alerts user when this happens.
- Bug fix: Import of data in text files changed so that broadest time interval checked for holes. This may slow down import of data. Some users reported holes in imported data form DOS MFI.
- Bug fix: Master List entries in columns 33 through 97 were not visible although could be accessed. This has been fixed.
Version 1 Build 76
- Enabled use of '+'/'-' keys when entering dates in Portfolio Gain/Loss Report.
Version 1 Build 75
- First Windows version released July 5, 2000.
Summary
Below is a list of many of the features of the program. Ticker symbols (used when downloading data from Dial Data) of thousands of mutual funds and market indices are listed in the Help file that comes with the program.
- Track any number of funds, variable annuities, stocks, and market indices on a daily or weekly basis.
- Graphs for fund-to-fund performance comparisons between any two dates, moving averages, volatility, momentum, relative strength.
- Sophisticated portfolio management system with numerous reports.
- Free sample data supplied.
- Haphazard data entry allowed. Enter data manually, transfer data to or from another program, or automatically download data over internet from Dial Data. Handles distributions easily for adjusting prices.
- Prints all data and graphs.
- Easy data Backup/Restore system included.
Example Screens
Click on any screen to display a larger view.